주요 콘텐츠로 건너뛰기

Great workout insights start with great data presentation. The best fitness apps don’t just collect numbers — they turn them into clear, actionable stories that help users train smarter, prevent injury, and stay motivated.

Below is a focused, design-led guide to what the BEST workout data insights and charting should include, why each element matters, and practical examples of how to present them.

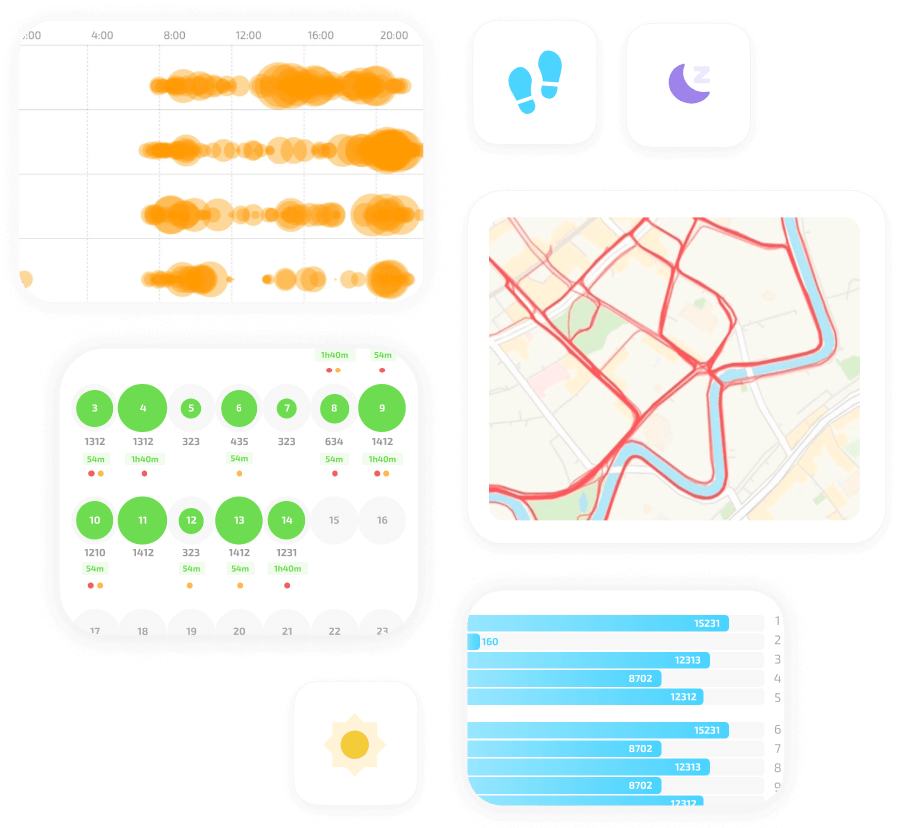
앱 분석 비주얼의 운동 데이터 인사이트: 시간별 버블 히트맵, 걸음 수/시간 레이블이 있는 일일 원 달력, 빨간색 경로 히트맵 지도, 걸음 수 가로 막대 차트, 걸음 수, 수면, 햇빛에 대한 작은 아이콘 등이 있습니다.
Review calories, steps, routes, workout time and more with heatmaps, calendar views, and bar charts to improve performance

How does Fito’s workout data insight work?

  1. Principles of excellent fitness visualization
  • Clarity first: show the single most important takeaway per chart. Avoid noisy axes, redundant labels, and competing color scales.
  • Actionability: every visualization should suggest a next step (e.g., “shift workouts to morning,” “replace shoes,” “add rest day”).
  • Multi-scale views: allow instant switching between daily, weekly, monthly, and yearly timeframes to reveal both short-term patterns and long-term trends.
  1. Essential metrics to visualize
  • Workout time (minutes per session, total per week/month/year)
  • Calories burned (per session and cumulative)
  • Steps (daily totals and trendlines)
  • Distance and pace (running, cycling)
  • Heart-rate zones and time-in-zone
  • Route density and segment performance
  • Sleep scores and recovery metrics
  • Sunlight exposure and outdoor time
  • Training load and acute:chronic workload ratio (for injury prevention)
  1. Best chart types and when to use them
  • Time-series line charts: ideal for pace, calories, steps, sleep score trends. Use smoothing (moving average) to reveal trend without masking variability.
  • Stacked bar charts: show composition of workout minutes by activity type (e.g., running vs strength) across weeks or months.
  • Heatmaps (temporal): visualize workout frequency and duration by weekday/hour or by month/day. Heatmaps instantly reveal consistency and ideal training windows.
  • Route heatmaps: overlay all tracked routes for a chosen period to reveal favorite segments and coverage density.
  • Bubble charts: encode three dimensions (time of day, weekday, session duration) in the Workout Time Heatmap — larger bubbles = longer sessions.
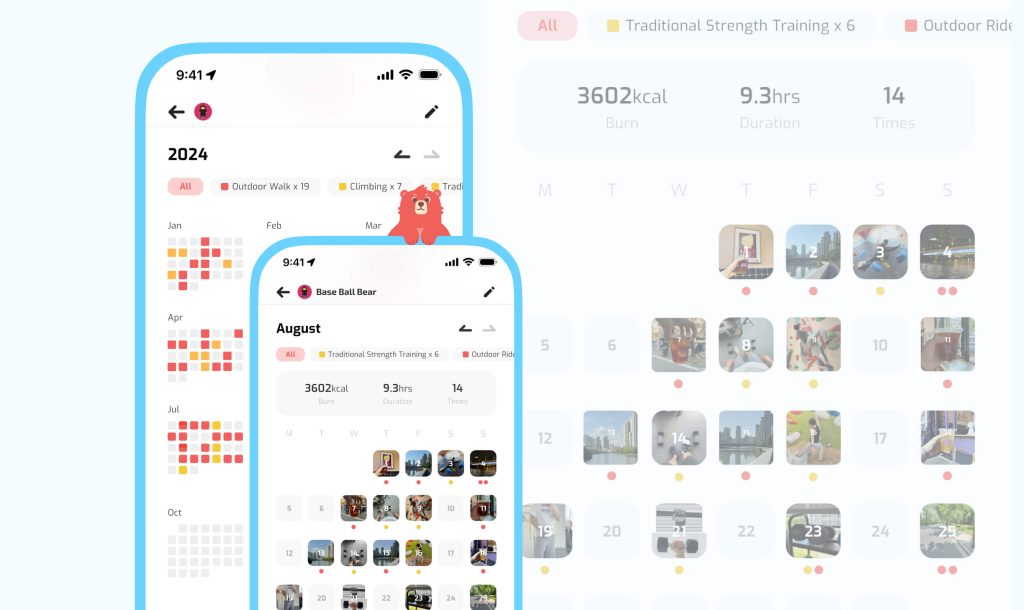
Fitness calendar recap showing monthly activity heatmap and daily workout thumbnails
Fitness calendar recap: monthly heatmap, daily workout thumbnails, and summary stats
  1. Innovative, high-value visualizations
  • Workout Time Heatmap (bubble-grid)
    • Layout: weekdays on one axis, hours-of-day on the other (or months vs hour-of-day).
    • Encoding: bubble size = cumulative session duration in that slot; color = average intensity or heart-rate zone.
    • Use: identify “power hours,” gaps, and opportunities for habit-building.
  • Route Heatmap (cumulative trail overlay)
    • Layout: map overlay showing density of GPS traces over a chosen span (month/year).
    • Encoding: brighter/warmer colors for frequently used segments; fading for less-used paths.
    • Emotional value: evokes a “lifetime footprint” and helps choose repeatable training segments.
  • Time-in-Zone Sankey or Stacked Area
    • Show how time distributes across heart-rate zones per session or weekly. Sankey-like flows can show shifts across weeks (more time in zone 4 this month than last).
  • Correlated Multi-axis Panels
    • Example: top panel = daily workout minutes (bar), middle = sunlight minutes (line), bottom = sleep score (area). Synchronized x-axis reveals visually how these move together.
  • Yearly / Monthly “Fog of World” Montage
    • A stylized map showing a month’s routes with artistic treatment — useful as both data and an emotional artifact.
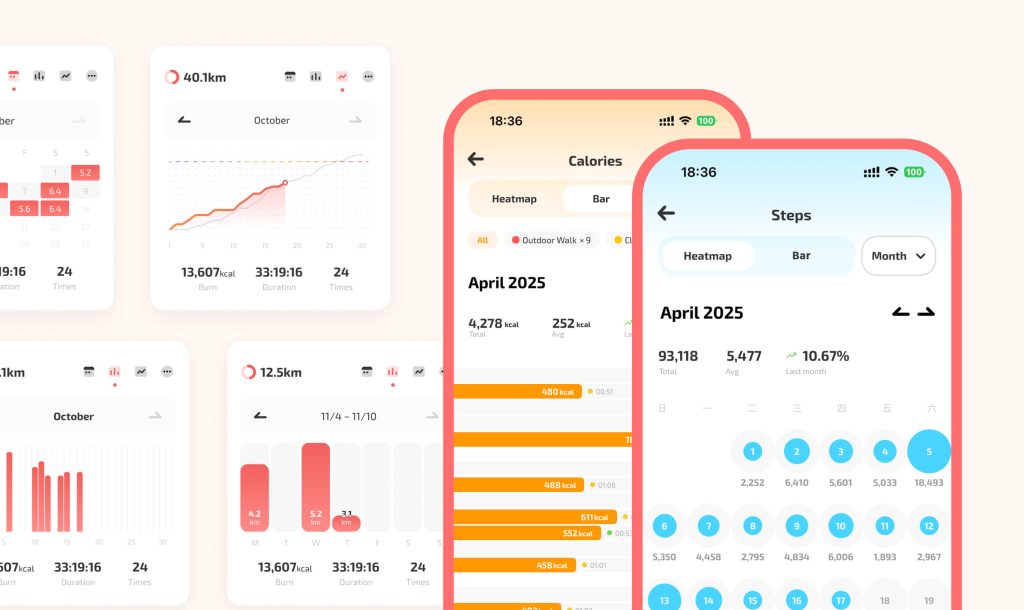
Fitness Data Analysis: charts and visualizations for calories, steps, routes, sleep, and sunlight exposure
Review calories, steps, routes, sleep scores, and more with intuitive charts and heatmaps
  1. Interaction and UX patterns that make charts useful
  • Brushing & linking: select a date range on the calendar to update all charts and map views simultaneously.
  • Tooltips and contextual cards: hover or tap to see session summary (route thumbnail, calories, gear used, photo).
  • Smart comparisons: allow quick comparison of two periods (this month vs last year same month) with differences highlighted.
  • Filter by tag: instantly show charts filtered to a specific shoe, coach, gym, or activity type.
  • Threshold alerts & recommendations: visually mark when metrics cross critical thresholds (e.g., acute:chronic load > 1.5) and suggest actions.
  1. Design details that improve comprehension
  • Use perceptually-uniform color palettes and maintain consistent color meaning across charts (e.g., running = red, cycling = green).
  • Limit series per chart to avoid clutter; offer small-multiple alternatives for many-category comparisons.
  • Provide accessible variants: high-contrast palettes, larger fonts, and clear legend alternatives for screen readers.
  • Use subtle animations to show changes without distracting — e.g., a smooth transition when changing time ranges.