Сами по себе цифры не мотивируют к переменам - их мотивируют закономерности. Пакет анализа и визуализации фитнес-данных Fito превращает ваши фитнес-данные в четкие и красивые выводы, которые помогут вам понять, что вы делаете, почему это важно и как совершенствоваться.
От калорий и шагов до годовых карт маршрутов, солнечного света и качества сна - Fito объединяет все в инновационные графики и интерактивные представления, чтобы ваши решения о тренировках были обоснованными, а не догадками.
Что такое анализ фитнес-данных Fito - полная картина вашего здоровья и активности
Fito объединяет множество потоков данных, чтобы создать 360-градусную картину вашей фитнес-жизни:
- Сожженные калории (за тренировку, ежедневно, ежемесячно, ежегодно)
- Шаги и тенденции шагов
- Время тренировки (продолжительность занятий и суммарные минуты)
- Ежегодное и ежемесячное отслеживание маршрутов (бег, езда на велосипеде, походы)
- Воздействие солнечного света (при наличии данных об устройстве/местоположении)
- Показатели сна и тенденции сна
- Зоны пульса, темп, каденция и другие специфические для каждого вида спорта показатели
- Ручные теги и контекстуальные данные (снаряжение, тренер, расходы, фотографии)
Инновационные диаграммы, которые позволяют понять всю сложность ситуации
Приборная панель Fito выходит за рамки базовых линий и пирогов. Она предлагает визуальные инструменты, основанные на данных, которые быстро и красиво раскрывают поведение и производительность.
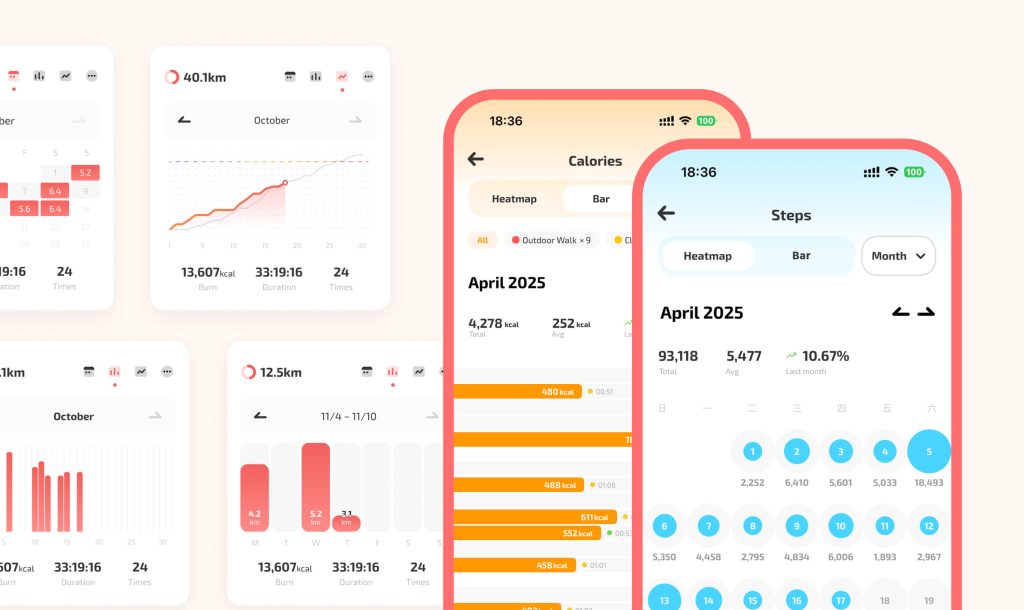
- Тепловая карта времени тренировки - посмотрите, когда вы действительно двигаетесь
Один взгляд подскажет вам, какие окна тренировок вы наиболее часто посещаете. Тепловая карта времени тренировки отображает частоту и продолжительность ваших тренировок на временной сетке:
- Группируйте по дням недели: узнайте, кто вы больше всего любите тренироваться по выходным, спринтер в обеденный перерыв или атлет в будни и вечером.
- Группировка по месяцам: выявление сезонных изменений в продолжительности тренировок (более длительные походы в выходные летом, более короткие вечерние пробежки зимой).
- Визуальное кодирование: размер круга (или интенсивность плитки) представляет собой совокупную продолжительность - чем больше/ярче круг, тем больше времени вы потратили на тренировку в этом слоте.
- Практическая польза: выберите неиспользуемые окна, чтобы добавить короткие тренировки, или закрепите высокоэффективное время в качестве постоянных блоков привычек.
- Тепловая карта маршрута - раскрасьте год своего движения
Fito накладывает ваши отслеживаемые маршруты за месяц или год, чтобы создать тепловую карту маршрута: плотные маршруты светятся ярче, показывая ваши любимые пути и схемы передвижения.
- "Туман мира" вид: перекрывающиеся пробежки или поездки создают светящуюся карту, которая кажется живым отпечатком вашего года.
- Долгосрочная перспектива: смотрите на принадлежащие вам регионы - окрестности, любимые маршруты или места путешествий с богатой детализацией.
- Открываемость: определите часто используемые сегменты для интервальных тренировок или найдите новые вариации, обнаружив малоиспользуемые соседние дорожки.
- Эмоциональная отдача: карта - это не просто данные, это визуальный дневник того, где вы побывали, вызывающий приятное чувство "одна жизнь - много миль".
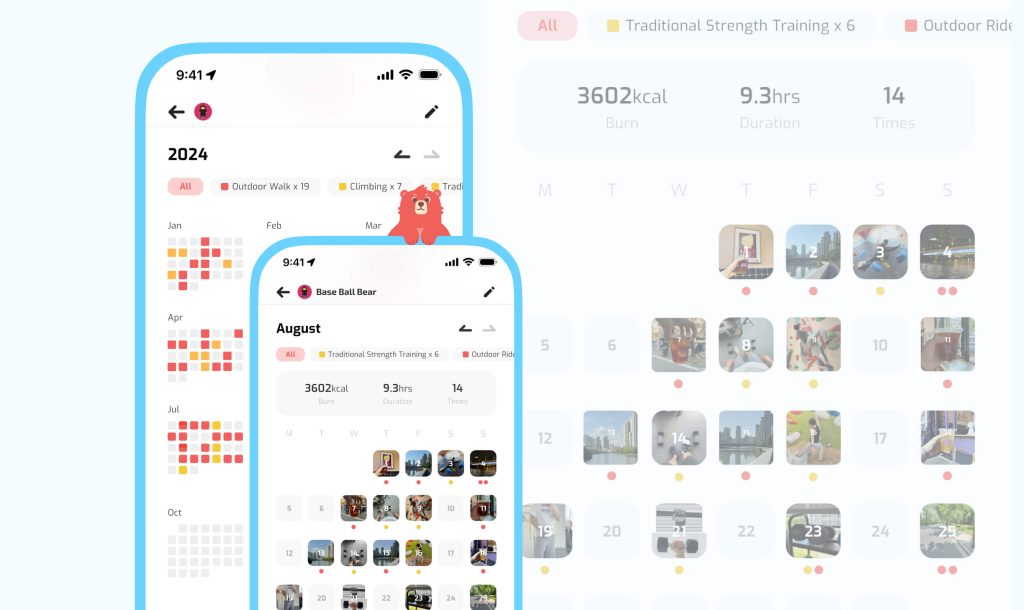
- Календарь на месяц и год - история с первого взгляда
Календарные визуализации Fito превращают журналы в доступную временную шкалу:
- Ежемесячный просмотр: дни тренировок выделены цветом, иконки типов активности и быстрые всплывающие окна для подведения итогов занятий.
- Вид за год: элегантный тепловой календарь (как фитнес-настроение), подчеркивающий последовательность, полосы и пробелы.
- Уменьшение: коснитесь любого дня, чтобы увидеть полную информацию - маршрут, фотографии, метки, калории и использованное снаряжение.
- МотивацияВидеть заполненный календарь - мотивирует, а пустые участки помогают планировать циклы догонялок или отдыха.
- Гибриды Heatmap и Bar - контекстное сравнение
Для показателей, которые зависят от интенсивности и частоты (шаги, минуты тренировки, воздействие солнечного света), Fito использует гибриды:
- Соотношение солнечного света и активности: наложите часы солнечного света и минуты тренировки, чтобы понять, влияет ли дневной свет на последовательность ваших тренировок.
- Тепловая карта шагов с пороговыми значениями целей: посмотрите, в какие дни достигаются цели по шагам, а в какие - нет, и как это соотносится с тренировками.
- Складывание гистограмм: сравните типы тренировок из месяца в месяц (бег, велоспорт, силовые нагрузки), чтобы обеспечить сбалансированность тренировок.
Дизайн и UX - красота и практичность
Fito сочетает в себе эстетический лоск и разборчивость:
- Продуманные цветовые палитры подчеркивают различия, не перегружая их.
- Плавная анимация делает переходы (сверление, изменение фильтров) интуитивно понятными.
- Минималистичные иконки (ботинок, ракетка, солнце, луна) привязывают графики к контекстным тегам, которые вы уже используете.
- Опции доступности: высококонтрастные режимы и масштабируемые шрифты для удобства чтения.

